Showing posts with label STAR. Show all posts

Monday, 2 January 2017

Starcom Systems Financial Analysis

None of the information below should be viewed as financial advice.


Data:


Financial information prior to the FY 2014 results was not included due to a move from accrual accounting to cash accounting and some figures in this report have been rounded for ease of use.

Starcom Report in USD Revenue/Million USD Recurring SAS Revenues/Million USD Operating Loss/Million USD Operating Loss As A % of Revenue Cash Used in Operations/Million USD Cost of Sales/Million USD
Yr End December 2014 5 1.3 2.9
58.00
0.831 2.49
Six months to June 2015 2.64 0.793 0.691
26.17
0.261 1.48
Yr End December 2015 5.1 1.6* 1.6
31.37
0.4 1.9**
Six months to June 2016 2.5 0.845 0.613
24.52
0.2 1.55
Yr End December 2016 - - - - - -


*1.18m Revenues after cost of sales and administration expenses.
** Does not include a 1.1m decrease in inventories.


Analysis:

While the data collected above is useful for achieving a comparative understanding of Starcom’s historical performance year on year, it’s significantly more useful to analyse this data in acknowledgment of the company’s more recent achievements. 

The below quotes are taken mainly from the 2015 FY results:

  • “we remain cautiously confident that second half revenues should comfortably exceed the first half and therefore that annual revenues will exceed last year’s"
  • “The Company is hopeful that it will return to profitability during the year ending 31 December 2016 by converting its strengthening pipeline into growing sales across the product range.”
  • “the recurring income flowing from the Company's SAS monthly fees is also expected to grow, and should reach nearly a third of the total revenues. This is a stable and high margin source of income for the Company that is gradually becoming the foundation for covering most of the overheads of the business.”
  • Raised £150,000 in late November in response to “investor demand” and £300,000 in mid October.
  • Collaboration deal agreed with SATO for North American market.
  • New contract signed with Pinnacle for Kenyan market.
  • New product launches for: Helios Hybrid, Watchlock Pro and Kylos Air.


Cash Position:

The use of only £200,000 cash in the six month period to June 2016 is a clear indication that major savings initiatives have taken place in the company, which will ultimately assist in making the company profitable in the near term.

Moreover, having raised a total of £450,000 (of which £150,000 was to meet investor demand) in October and November, it suggests that the likelihood of another raise in the short term is very low, which will support investor morale at these levels. Furthermore, the time gap between now and the placing of the shares suggests that any flippers of the placing are likely out of the stock now.


Revenues:

Recurring SAS revenues amounted to $1.6m in in the FY of 2015 and with these representing a very high margin product to the company, their growth in tandem with regular sales places upwards pressure on the overall product margins of the company (38% as of H1 2016).

In fact, the break down at the end of the 2015 FY report suggests that the SAS products had a profit margin of 73.8%, which is expected to only grow now that the system is fully in place and requiring less investment.

Revenue from sales moved up inline with expectations in FY 2015 ad with an evermore diversifying sales base to work from these are expected to both continue and expand at a faster rate as collaborations with SATO pay off. 

In addition to this, the publicly available data from Gurtam.com suggests that ~150 units have been sold in December via the Russian distributor for Starcom. Moreover, in July there were approximately 1,000 registered units online via Gurtam and this figure is now ~2150, illustrating the major push up we should hopefully see in SAS recurring revenues and pure sales revenues.


Operating Losses and Cost of Sales:

The operating loss year on year from 2014-15 was down 45%, in part due to a significantly reduced cost of sales, which fell 24%, but also due to major savings being made on general and administrative expenses, including a saving of $200,000 in management salaries.

Interestingly the operating loss as a percentage of revenues in FY 2014 was 58%, compared to 31.37% in FY 2015 and more recently 24.52% in H1 2016. This suggests that the move to profitability could come very soon, as it’s clear that losses are being absorbed at a faster rate as the company progresses.

Moreover, this fits in with the company’s expectation that “it will return to profitability during the year ending 31 December 2016”.


Summary:

  • A more than 50% reduction of cash in operations  between FY 2014 and FY 2015 suggests that the BOD are making significant progress in reducing the company’s outgoings and that they stand a good chance of meeting their expectations of reaching profitability by the end of 2016.
  • Rising high margin SAS revenues will feed through into the overall sales margin for Starcom, pulling their overall margin significantly higher as more units come online.
  • Compared to FY 2014, FY 2015 saw a 45% drop in operating losses, suggesting that at the current rate of business growth, a move to profitability should occur soon (bar black swan events).


For a relative valuation compared to other companies in the same sector, I would direct people to work I’ve done previously on price to sales ratios:


https://twitter.com/ProAIMTrader/status/778126679898263552

Friday, 9 September 2016

Starcom Systems Cash Position Explained

Disclaimer: I don't have a license to distribute financial advice and therefore this should be viewed as being for entertainment purposes only.


Starcom Cash Position Explained:


It's been notable that since the company's interim results this week there has been a lot of question about the company's cash position. I hope to be able to clarify this in this short blog:


On the face of it, cash of $46,000 admittedly doesn't look too appealing, however when you dig further into the background the apparent lack of a need for cash becomes clearer.


SAS revenues in the first half year came to $845,000 (this is effectively an electronic online data management platform for tracking systems) and now the system is in place I am told this is pure profit on the bottom line - these revenues are expected to increase in the second half of the year and are gathered monthly.


These latest results cover the six month period ending in June, so if we assume that they don't grow their SAS revenues (to keep the maths simple) then in the period since the end of June they will have taken in a further $281,666 over July and August:

$845,000/6 =$140,833

$140,833*2 =$281,666


Although remember in your own calculations that they are expecting SAS revenue to grow in the second half of the year, so you can probably increase this on paper.


Now the company also stated that they used net cash of $200,000 in the half year, so if we take this monthly figure ($200,000/6) multiplied by two to cover the months of July and August away then we have an effective cash balance of:


$281,666-$66,666

= $215,000


Furthermore, you have to add on to this figure extra sales referred to in the results:

"The new version of the Watchlock known as Watchlock Pro was effectively only launched into the market during July 2016, yet some sales have already been booked following the launch." 


Realistically, factoring in a small level of SAS growth and say a modest $25,000 of sales since the results takes us to a cash position of ~$250,000-300,000, in my opinion.


Food for thought...

The Masked Stock Trader

Wednesday, 7 September 2016

Starcom Systems Interim Results (07/09/2016)

Disclaimer: I don’t have a licence to distribute financial advice and thus the following work should be viewed as being for entertainment purposes only.


Starcom Interim Results (07/09/2016)


This post is a summary of the last set of interim results for Starcom Systems, which can be found here:


http://www.lse.co.uk/share-regulatory-news.asp?shareprice=STAR&ArticleCode=7zpp0hjo&ArticleHeadline=Interim_Results


Apologies if this is slightly garbled and if I’ve accidentally repeated sections. The coloured bullet points are all taken directly from the RNS above, which I would encourage people to read fully. 


Positives: 

Cash requirements only ~$200,000 for the first half of the year, with much of this likely being down to the:


- Major savings of 26% in general and administrative expenses were achieved


SAS revenues are very strong (in the weak half of the year too):


- The first half results include $845,000 of SAS revenues which continue to show growth. These SAS revenues were not at their full potential in the first half due to customer delays in activating the software. We believe this will be rectified in the second half, resulting in further growth in SAS revenues. 


Decreased operating loss to $440,000 (~18% of revenue) from $500,000 in the previous half year.


Negatives:

The only negatives here are that margins and revenues were both slightly down relative to the first half of 2015:


- Revenue for the period of $2.5m (H1 2015: $2.6m)

- Gross margin of 38% (FY 2015; 40% and H1 2015:44%)


Regardless of this, regarding their gross margin the company commented that:


- We also expect the gross margin to improve as SAS revenues normalise. 


Moreover, the underlying effect of this has clearly been offset with cost reductions elsewhere in the overall business pipeline, as we can see from the loss reduction from $691,000 to $613,000:


- Loss for the period after tax reduced to $613,000 (H1 2015: $691,000)

Also, it looks as though the Kenyan deal has been slower to implement than expected, delaying some of the revenue generated via SAS, but the company expects this to:

- “change during the second half of the year”

Assuming this happens, we can expect (as I talk bout more below) for revenue to be backloaded in the year, meaning their next results should look very nice.


Market Maker’s Positioning:


This section might be better understood with a look at this brief explanation/example of a market maker’s job:


In the month prior to these results being released, I’d been of the opinion that market makers had positioned their proprietary trading desks somewhere between flat and long Starcom stock. Being able to almost always sell in volumes multiple times above Normal Market Size (NMS) at premiums to the advertised bid price made me suspect that they were positioning this way.

When it then became apparent that the offer was almost always very thin (200,000 shares maximum on a normal day) prior to a negotiated trade, I feel that on a balance of probabilities the market makers had stock held long in Starcom.

In the last three or four days however, I suspect that much of this long stock was de-risked to create a flat book prior to the interim results released today (hence the block selling some spotted at certain points of higher volume hitting the offer prices in the market).

After the somewhat inevitable initial drop all AIM companies seem to get on their results day, we saw decent sized buys appear (initially sporadically) that helped to even out the early selling from loose holders. So far the market has since then been pretty balanced for the rest of the day, although again, it was noticeable that the shares on offer were limited so sub 400,000 and by the end of the day more large buyers had pulled us back into the strong support zone between 3.25/3.50p. 

Moving forwards, I think that it’s likely that market makers would look to reposition themselves net long again on Starcom stock for a few reasons:

  • The free float is quite small and there are a lot of sticky holders, meaning that a small amount of buying shift the stock significantly.
  • The outlook discussed below is very positive regarding the second half of the year, so on expectations trading volumes leading in to that period should be increased.
  • One of the stickier holders is almost always topping up on dip, so momentum is generally upwards.


Fundamental Outlook/Analysis:

On balance, I would say that there are significantly more positives going forwards than negatives. in particular, the company’s own forward (implied) guidance regarding the second half of the year is particularly useful for current investors:


  • Strong sales pipeline for H2 
  • “…there are a number of sales opportunities being pursued, including following the launch of Watchlock Pro, which are expected to lead to a significant improvement in the second half of the year."
  • As in previous years, we expect most of the second half revenues to fall into the fourth quarter.
  • There are some fairly significant sales opportunities being examined both in the US and elsewhere
  • we remain cautiously confident that second half revenues should comfortably exceed the first half and therefore that annual revenues will exceed last year’s
  • We have recently signed a small trial order under this system through our Miami office and are hopeful that larger orders will follow. 
  • We have also received very positive interest from distributors in Asia and South America.
  • We have now achieved recognition by a few major insurers whereby, in the case of valuable cargoes being shipped in containers, the cost of the Tetis is effectively offset by a waiver issued by the insurance company


Even though the gross margin has fallen from 44% to 38% compared to the first half of 2015, in this line of business, with the current cost levels being so low, you only need a small percentage extra business for that to have a significant impact on your overall earnings and profitability.

Also, with the operating loss being only 18% of their total revenues in the period, when you project revenue forwards and adjust for a stronger second half there’s quite a good chance of the company (in my opinion) generating a profit by the full yearly results.

Furthermore, with a company like Starcom in the growth phase of its business model, the above excerpts from the RNS suggest that a reasonable contract from a major would have a very significant impact on their underlying profitability. Much of this is (in my opinion) still likely to be generated in part from their tie ups with majors like Assa Abloy, Cambridge Security Seals or SATO.


I'll likely add to this piece as I continue my research here, so keep an eye out for changes (although i expect the majority is on here now).


For further fundamental reading and detail on the above business I suggest people look at these:


Thursday, 5 May 2016

Starcom Systems Research Report

Starcom Systems Research Report UPDATE:

Since my initial report was posted, I can confirm Miton have reduced as much as they intended to for the time being. The recent holdings RNS at 5% was indicative of this and my initial thoughts were then corroborated by information I've received privately, confirming that they've finished reducing. 

Moreover, as Miton had shares at 20p, 8-10p and 4p the likelihood is that they will be unlikely to liquidate any of their current holdings until at least after 4p has been strong on the bid.


Starcom Systems Research Report


The below information isn't to be classed as financial advice and apologies for the out of order references - Blogger seems to disagree with the system I had! 


Also, new information may be added to this report over time, as I add to my research.


Business Description (5):


Starcom Systems are an AIM listed company providing tracking systems for transportation, container, construction, utilities, telecoms, and pretty much anything high value items you might want to track.


They operate globally delivering bespoke solutions across eighteen countries.


Business Partners (5):


Some of the more notable partners and clients of Starcom Systems:


  • Partner with Porsche for dealer fitted tracking systems.
  • Watchlock (a joint venture owned by Swedish ABbloy - world’s largest lock manufacturer by volume).
  • SATO Global Solutions (Owned by SOFTBank - Japan)..
  • Cambridge Security Seals (global leader in tamper evident seals).
  • Great Brand.


Products (4):


The Watchlock: These were initially autonomous locking systems and the new Watchlock Pro is a significant improvement on version one thanks to the latest GPS and GSM technologies and a new version of the microprocessor with an extended battery life.


Both Mul-T-Lock and Starcom Systems will be actively marketing this new version during 2016 and customer feedback so far has been very positive. With a wholesale price that is 21% lower than the first version, it is hoped the Watchlock Pro will begin to contribute to overall sales in a meaningful way during 2016.


HELIOS: A  family of tracking products comprising standard units marketed at under US$100/unit with monthly fees of $1-3 for the monitoring of vehicles, including motorbikes, linked to GPS telecom services. As the market for HELIOS is highly competitive, Starcom Systems accepts, in many cases, a low margin on the initial hardware order but are able to secure a high margin and recurring revenues.


A key example here is the Pinnacle contract in Kenya signed in December 2015. The client's main interest was to monitor speed in vehicles and enable a quick and real time reports. The initial orders have been placed and already delivered and paid for. Regular monthly shipments have commenced and are expected to continue during 2016 and beyond.
Last year Starcom Systems developed a new version called the Helios Hybrid with the advantage of being able to utilise cellular and satellite communications for tracking continuity across large and remote areas. This is a niche market enabling a significantly higher unit price and recurring prices than the standard models and consequently higher margins.


TETIS: These are products to both monitor and safeguard container traffic. Many other prospective customers are in discussion with Starcom Systems regarding these products which not only monitor location but also temperature, humidity and light penetration to detect the sudden opening of the container. Given the millions of containers shipped around the world Starcom Systems only need a small percentage to achieve a large profit from the industry.


Competing products exist but are more expensive and take much longer to install.


The strategic partnership with Contguard in the US, allows us to offer services including a complete monitoring service and rental services on a per trip basis.


Many large end users welcome the provision of such services which avoid upfront capital expenditure and this business model is expected to play a larger part in the future for this product range.


KYLOS: The Kylos Compact Device is a sophisticated portable GPS tracker designed to monitor and determine the location of assets and possessions as well as providing a means to keep family members and pets safe. Sales of this unit are slowly building since its launch two years ago.


SAS: All the units are sold with connection to a central user friendly tracking software platform which can be either owned and operated by the user or by a third party. Monthly fees vary according to the product that is connected to the SAS control hub and generate recurring revenues to Starcom Systems. As the sales and install base of all units increase, it is hoped that these revenues will increase too, in absolute terms and as a percentage of total revenues. Being 100% software, this product no longer requires significant R&D investment and is therefore a major contributor to profitability.  


Company Financials (3):


General:


Market Cap: £3.74m
Shares in issue: 135,830,680


52 Week High: 8.38p
52 Week Low: 1.25p


30 Day Average Volume: 941,297


Bid: 2.25
Ask: 3.00


It’s worth noting that in reality the live spread is significantly tighter than this, but that recently the official spread has been widened by the market makers for seemingly no apparent reasons.


Recent Results (4):


-  Revenue for the year of US$5.1m (2014: US$5.0m)
-  Gross margin of 40% (2014: 50%)
-  Loss for the period significantly reduced to US$1.8m (2014: US$2.8m)
-  Overheads reduced by 27%
-  Total assets of $6.77m (£4.67m)


“The Company is hopeful that it will return to profitability during the year ending 31 December 2016 by converting its strengthening pipeline into growing sales across the product range.  In particular the gradual take up of Tetis and the new Watchlock Pro should contribute to this increase in sales, most of which we anticipate in the second half of the year.”


Director Credentials (much of this can be found on Starcom’s website):


Avraham (Avi) Hartmann (CEO):


  • Founder of Mobiltel Communication Services in 1996 and served as its CEO until it was bought-out by Pelephone, in 1999.
  • During this period he created a development and sales infrastructure which defined, developed, and marketed a GPS-based location product for vehicles, which was the first product of its kind in the country to use GPS technology.
  • In 2005, together with Doron Kedem and his son, Uri, he founded Starcom Systems.


Avi Engel:


  • Currently a private investor, company adviser and a non-executive director, Avi founded and led Pilat Media Global plc. as its CEO for twelve years until its sale for $100 million in March 2014.
  • Prior to that Avi was the CEO of Pilat Technologies International, also AIM listed and an HR services and software company.
  • With 25 years of public company experience on AIM and the TASE, Avi is deeply familiar with what it takes to strategize for long term shareholder value creation.
  • Avi holds B.Sc. in Industrial and Management Engineering from the Haifa Technion and an MBA from the Tel Aviv University.


Michael Rosenberg (Non-Executive Chairman):


  • Michael Rosenberg began his career in 1957 with the merchant bankers Samuel Montagu and Co Ltd, where he subsequently joined the board in 1972.
  • Left banking to co-found United Medical Enterprises Ltd, which provided management services and equipment services to hospitals internationally.
  • Michael became chairman of the British Healthcare Export Council (now known as A.B.H.I.) and led a number of trade missions overseas.
  • Michael was a shareholder and later chairman of what is now known as Numis Securities Plc from 1989 to 1999.
  • He has held a number of chairman and non-executive positions on the board of AIM-quoted companies, including Catalyst Media Group pl(current) and previously,Dori Media Ltd Pilat Media Global plc, Photon Kathaas Productions Ltd and Amiad Water Systems Ltd.
  • In 1994 Michael was awarded the OBE for services regarding trade with Hong Kong and has previously served as chairman of the DTI's committee on trade with Hong Kong and as a director of the China Britain Business Council.


Director Shareholdings:


Avraham (Avi) Hartmann: 20,711,168
Avi Engel: 498,334
Michael Rosenberg: 1,395,000
Uri Hartman: 22,111,166
Doron Kedmem: 22,111,166

Total Shares Held By Directors = 66,826,834


Total Number of Shares = 135,830,680


Directors Holding = 49.19% of the total issued shares.


These numbers can be confirmed in the 24th March 2016 RNS (2)


Institutional Shareholdings:


Notably Milton Group  also hold 16,926,666 shares, representing 12.5% of the issued shares (6).


Appetite for Raising Funds:


Holding almost 50% of the company it’s not in the interest of the board members to issue shares like confetti as some AIM companies do and thus I get the impression that unless it’s totally necessary for the progression of the business then they won’t.


Moreover, at the recent AGM one attendee reportedly said how Michael Rosenberg had said that the company had enough cash to to continue with the current plans for at least the rest of 2016 and that while he couldn’t guarantee the need not to raise funds, he suggested that the only scenario he could foresee for doing so would be if they required more working capital to fill a very large order.


Recent News:


  • US Investment Bank and Market Maker Stifel begins to quote prices for STAR.
  • Placing of shares with the board of directors and institutions to raise money to market and launch Watchlock (2).
  • Final Results (4)


Expected News:


  • WatchLock April Launch Update (2)
  • Updates on sales of all products (4)
  • Progress reports on the Sato joint venture and penetration into the US market (4)
  • News on further joint ventures across the globe

GPS Tracking Sector Value


With the industry set to reach a value of $3.5bn in 2019 (1), only a small percentage of this market space is required to achieve a significant upside to the current market capitalisation of the company.


Fundamental Analysis:


The majority of the reasons to be bullish on Starcom Systems will stem from them simply being a manufacturer and primary distributor of what will likely become a ubiquitous product across many industry sectors.


In addition, the heavily invested board of directors will add to the market’s confidence in the company succeeding in the long term - this isn’t a business designed to rip off shareholders through continual dilution of equity!


Their strong underlying business model combined with a rapidly growing industry makes it quite likely that the recent share price momentum to the upside will continue, with the technical outlook corroborating this argument.


The major brands and companies Starcom Systems work alongside are a further testament to their prowess in business. A significant example is Sato Global Solutions, which has yearly revenues in excess of $900m and yet approached Starcom Systems as a joint partner!


Moreover the statement in the 11th March final results (4) that: “The Company is hopeful that it will return to profitability during the year ending 31 December 2016 by converting its strengthening pipeline into growing sales across the product range.  In particular the gradual take up of Tetis and the new Watchlock Pro should contribute to this increase in sales, most of which we anticipate in the second half of the year.”, suggests that the company is likely running at a profit now and that the next set of results will be significantly improved from the last set.


These factors in combination with the company’s low level of director lent debt, make it a very exciting company (especially considering that the market capitalisation of the company is only £3.5m) in the near and medium terms with regards to their potential growth prospects.


The addition of US market maker and investment bank Stifel to quoting the shares has also led me to suspect that their sales and trading departments are advertising Starcom Systems shares to their private clients, or that a potential takeover bid/acquisition could be being processed by a US based company.


The multi-level architecture of Stifel in combination with how they have been mostly bidding for stock since commencing the quotation of Starcom Systems shares, certainly has led me to suspect that there are large private/institutional buyers circling around Starcom Systems - with an average daily volume of only around 900,000 shares at the moment your profitability only making markets is heavily limited as a new entrant.


Technical Outlook:


Macro Time Frame:
Screen Shot 2016-05-04 at 17.24.39.png


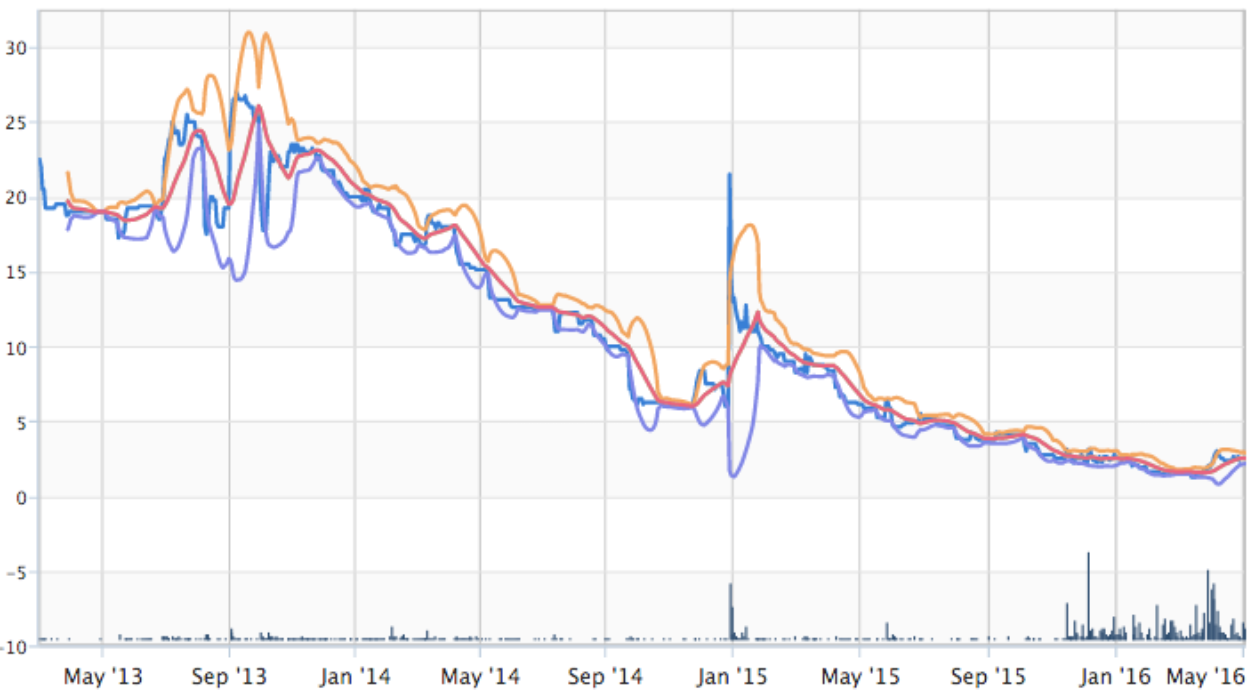
  • Clearly the macro time frame is a technical story of a sell down in the stock followed by a recent rally from the major lows.
  • This rally has coincided with a turn in some of the major moving averages, notable the 20 day moving average and its two standard deviations that make up the bollinger bands in the chart.
  • At these levels this is a very oversold stock from which you would expect a continuation of the trend (the backbone concept of technical analysis) in the current upwards direction.


Screen Shot 2016-05-04 at 17.24.12.png


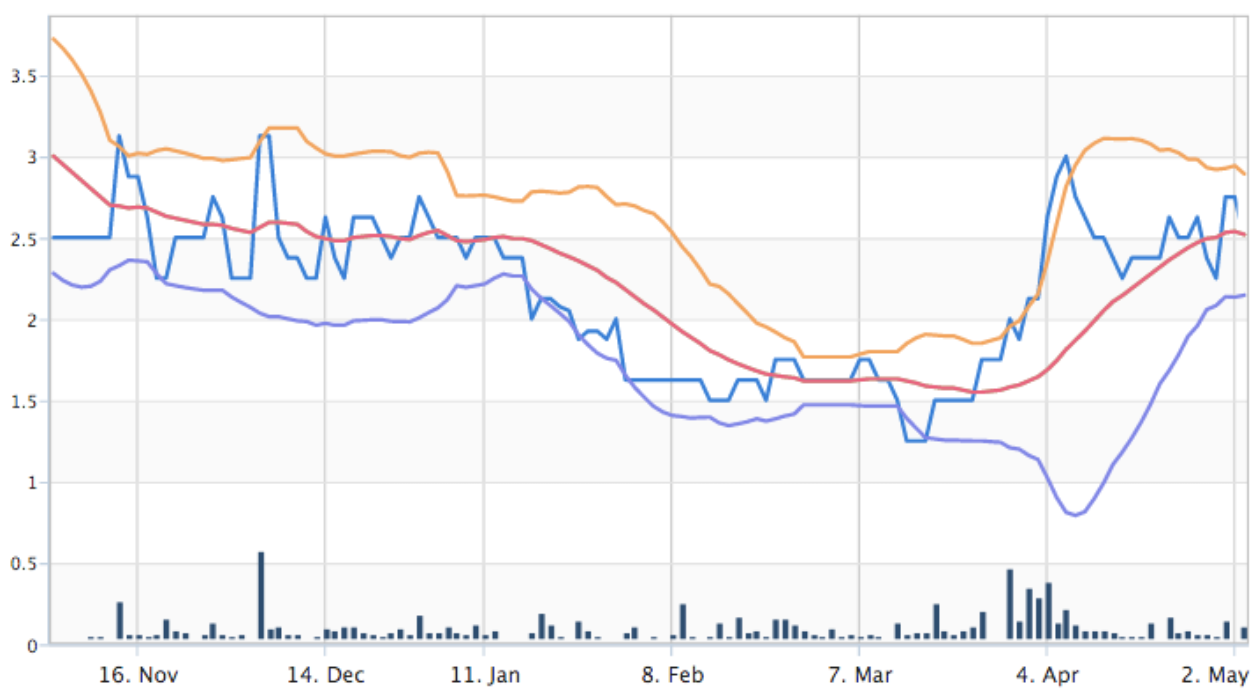
  • On the sixth monthly time frame we can clearly see the reversal from the 52 week low at 1.25p and the subsequent rise to the 2-3p range.
  • The bollinger bands are notably beginning to tighten - often seen before an expansive upwards move in volatility - suggesting that the market is currently trading sideways awaiting new buying or selling pressure.
  • In particular, the previous resistance at 2.5p is now the current support level for the stock moving forwards, with support also sitting strongly at 1.6p and 1.5p.

Screen Shot 2016-05-04 at 17.24.25.png


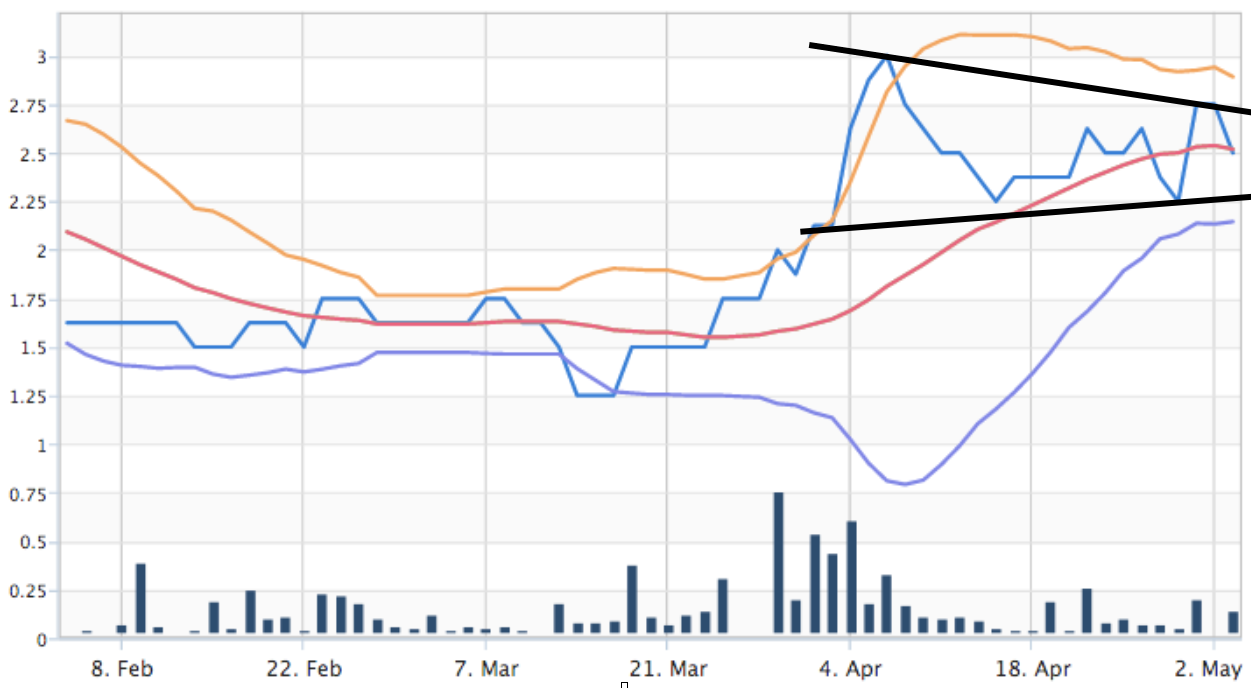
  • On the three month time frame we can clearly see that a consolidation pattern is forming through a bullish pennant, which usually precedes an expansive upwards move in the new upwards trending market.
  • The target from a break of this pennant would be the 5p level, which conveniently sits inline with the next large resistance level.
  • The only real negative here is that the volume can be reasonably low, making it a possible challenge to gain liquidity in large size for some.


References:


  1. http://www.lse.co.uk/share-regulatory-news.asp?shareprice=STAR&ArticleCode=9z5gqbxg&ArticleHeadline=Placing_and_Directors_Dealings